The idea
The analysis a good exam deserves.
A mark tells you a student scored 62%. It doesn’t tell you the class struggled with fractions, that question 7 was too hard to be fair, that section B is slipping, or that this child has climbed steadily across three tests. That analysis usually lives in a teacher’s spreadsheet, or nowhere at all. Inspire Analysis reads it straight from the marks you enter in Inspire Assessment.
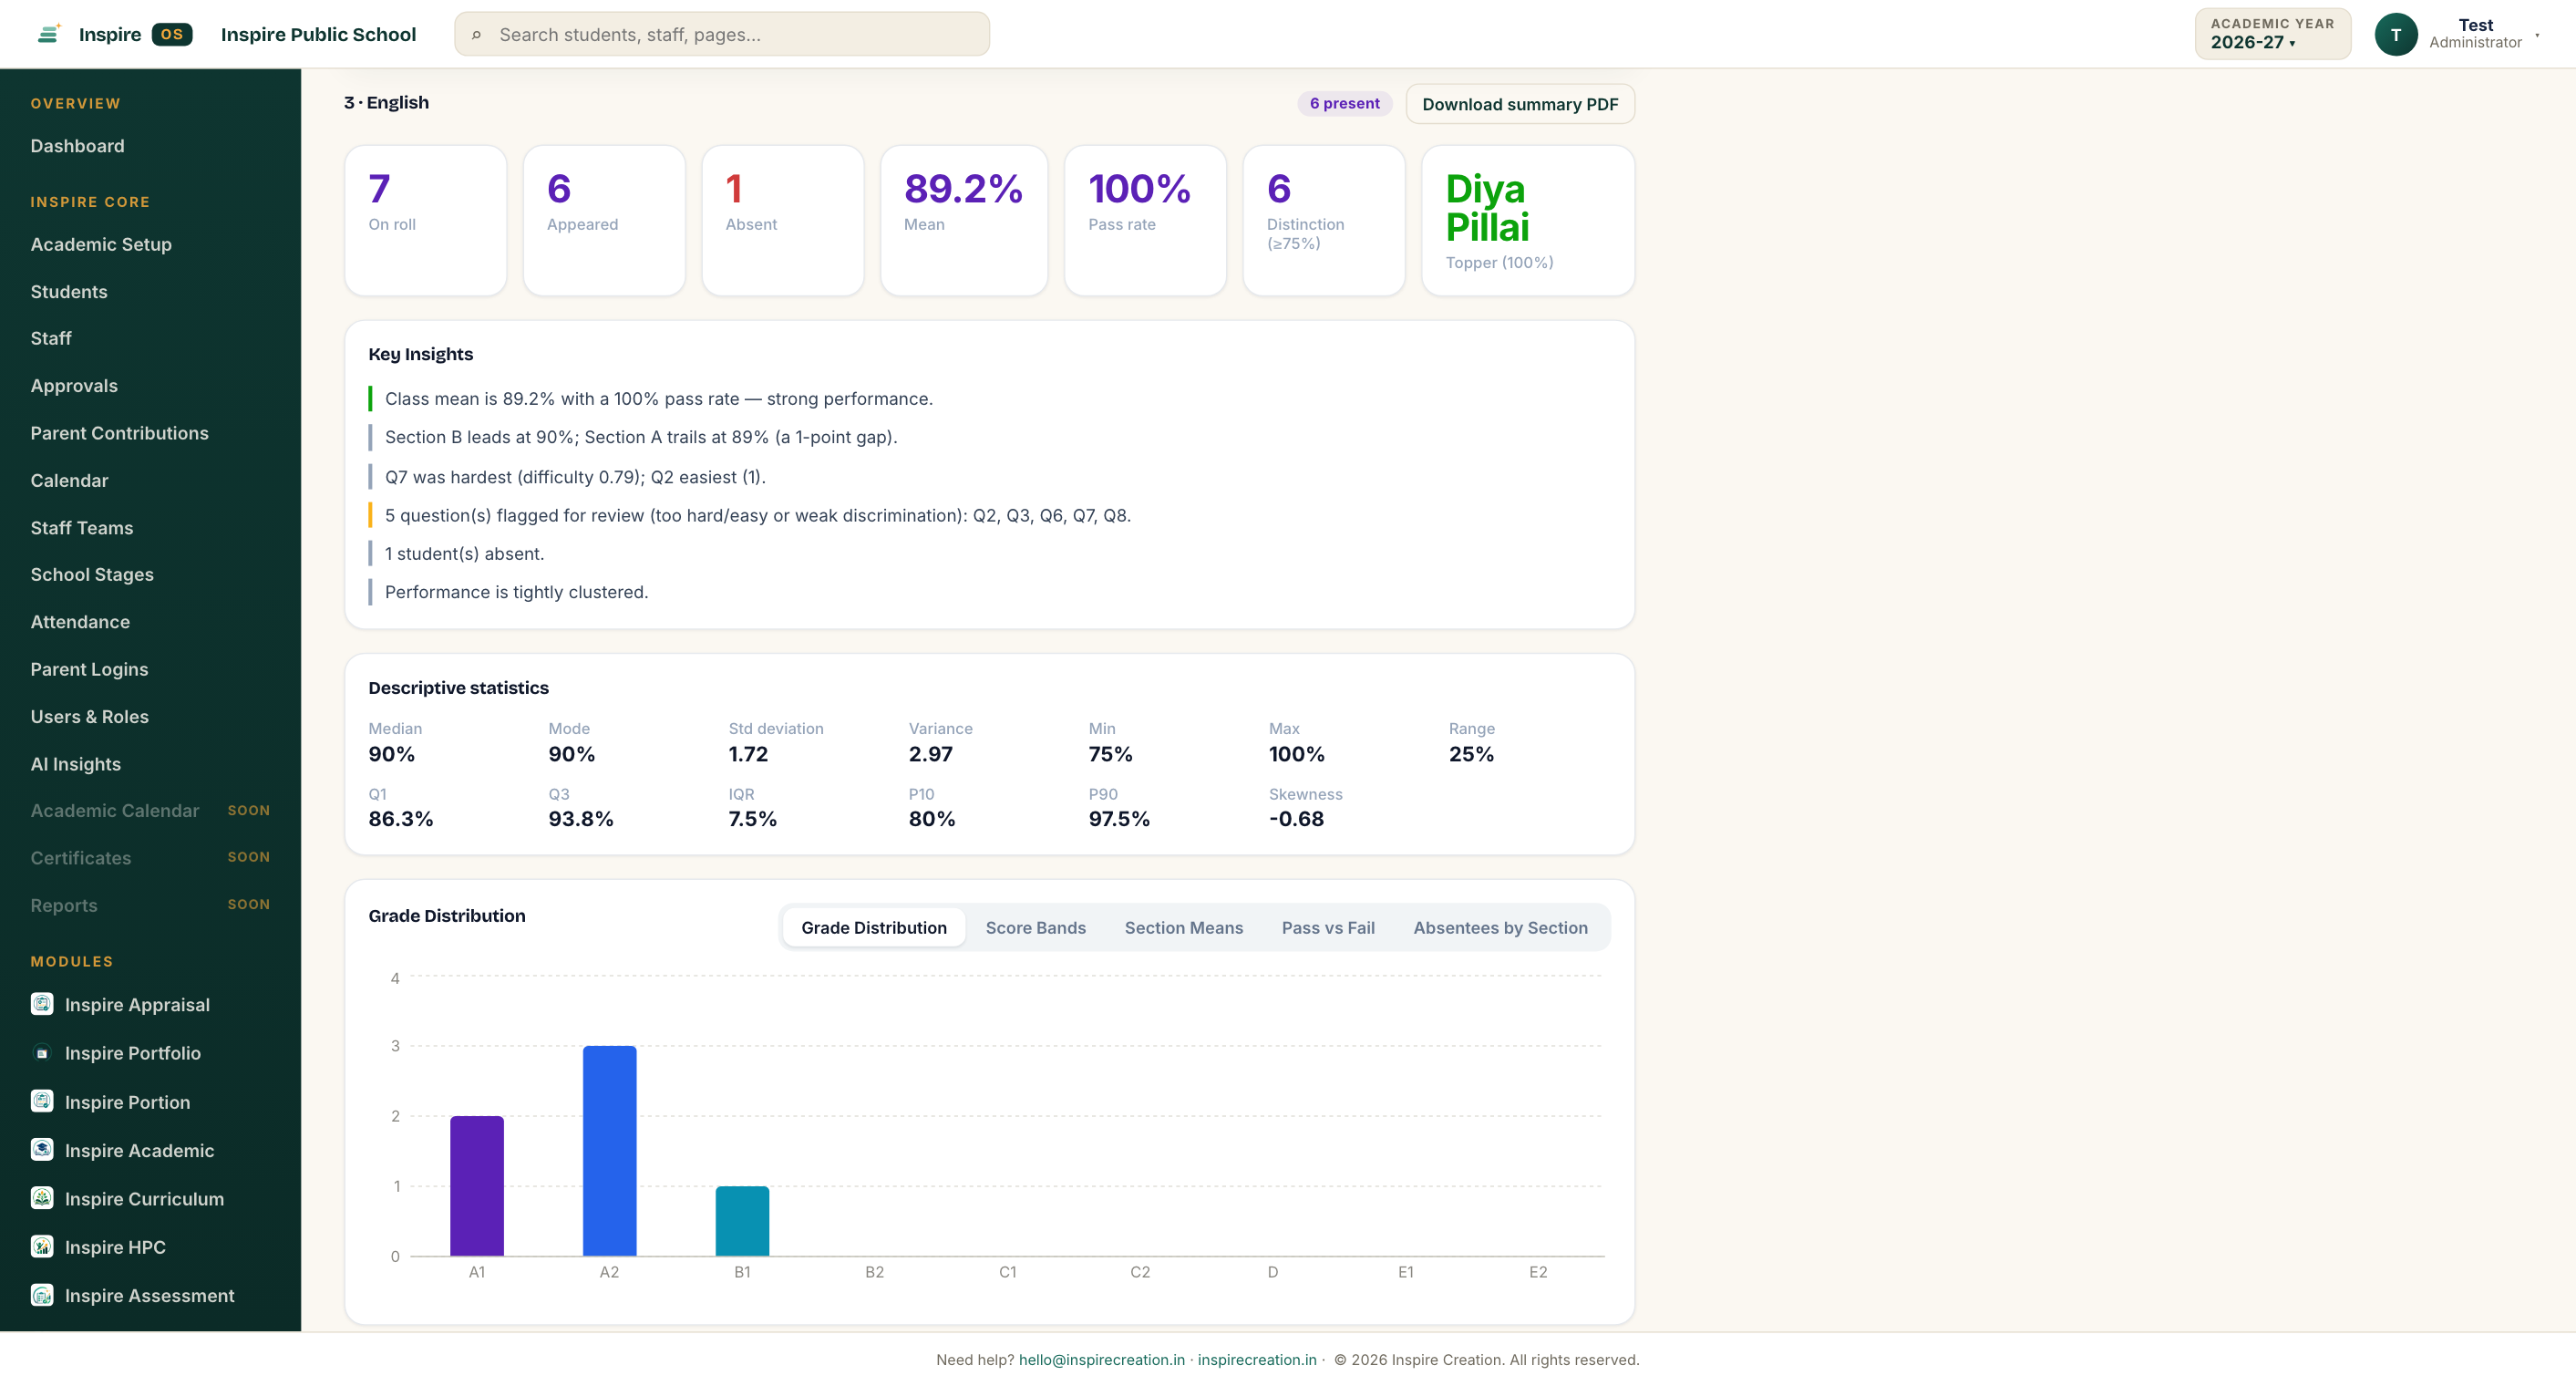
Class dashboard at a glance
Mean, median, spread, pass rate, grade distribution and the toppers — with the strongest and weakest areas surfaced as plain-language insights a leader can act on.
Section by section
Compare every section of a class side by side — mean, pass rate, the strongest and weakest sections, and a question-by-question heatmap that shows exactly where each section needs attention.
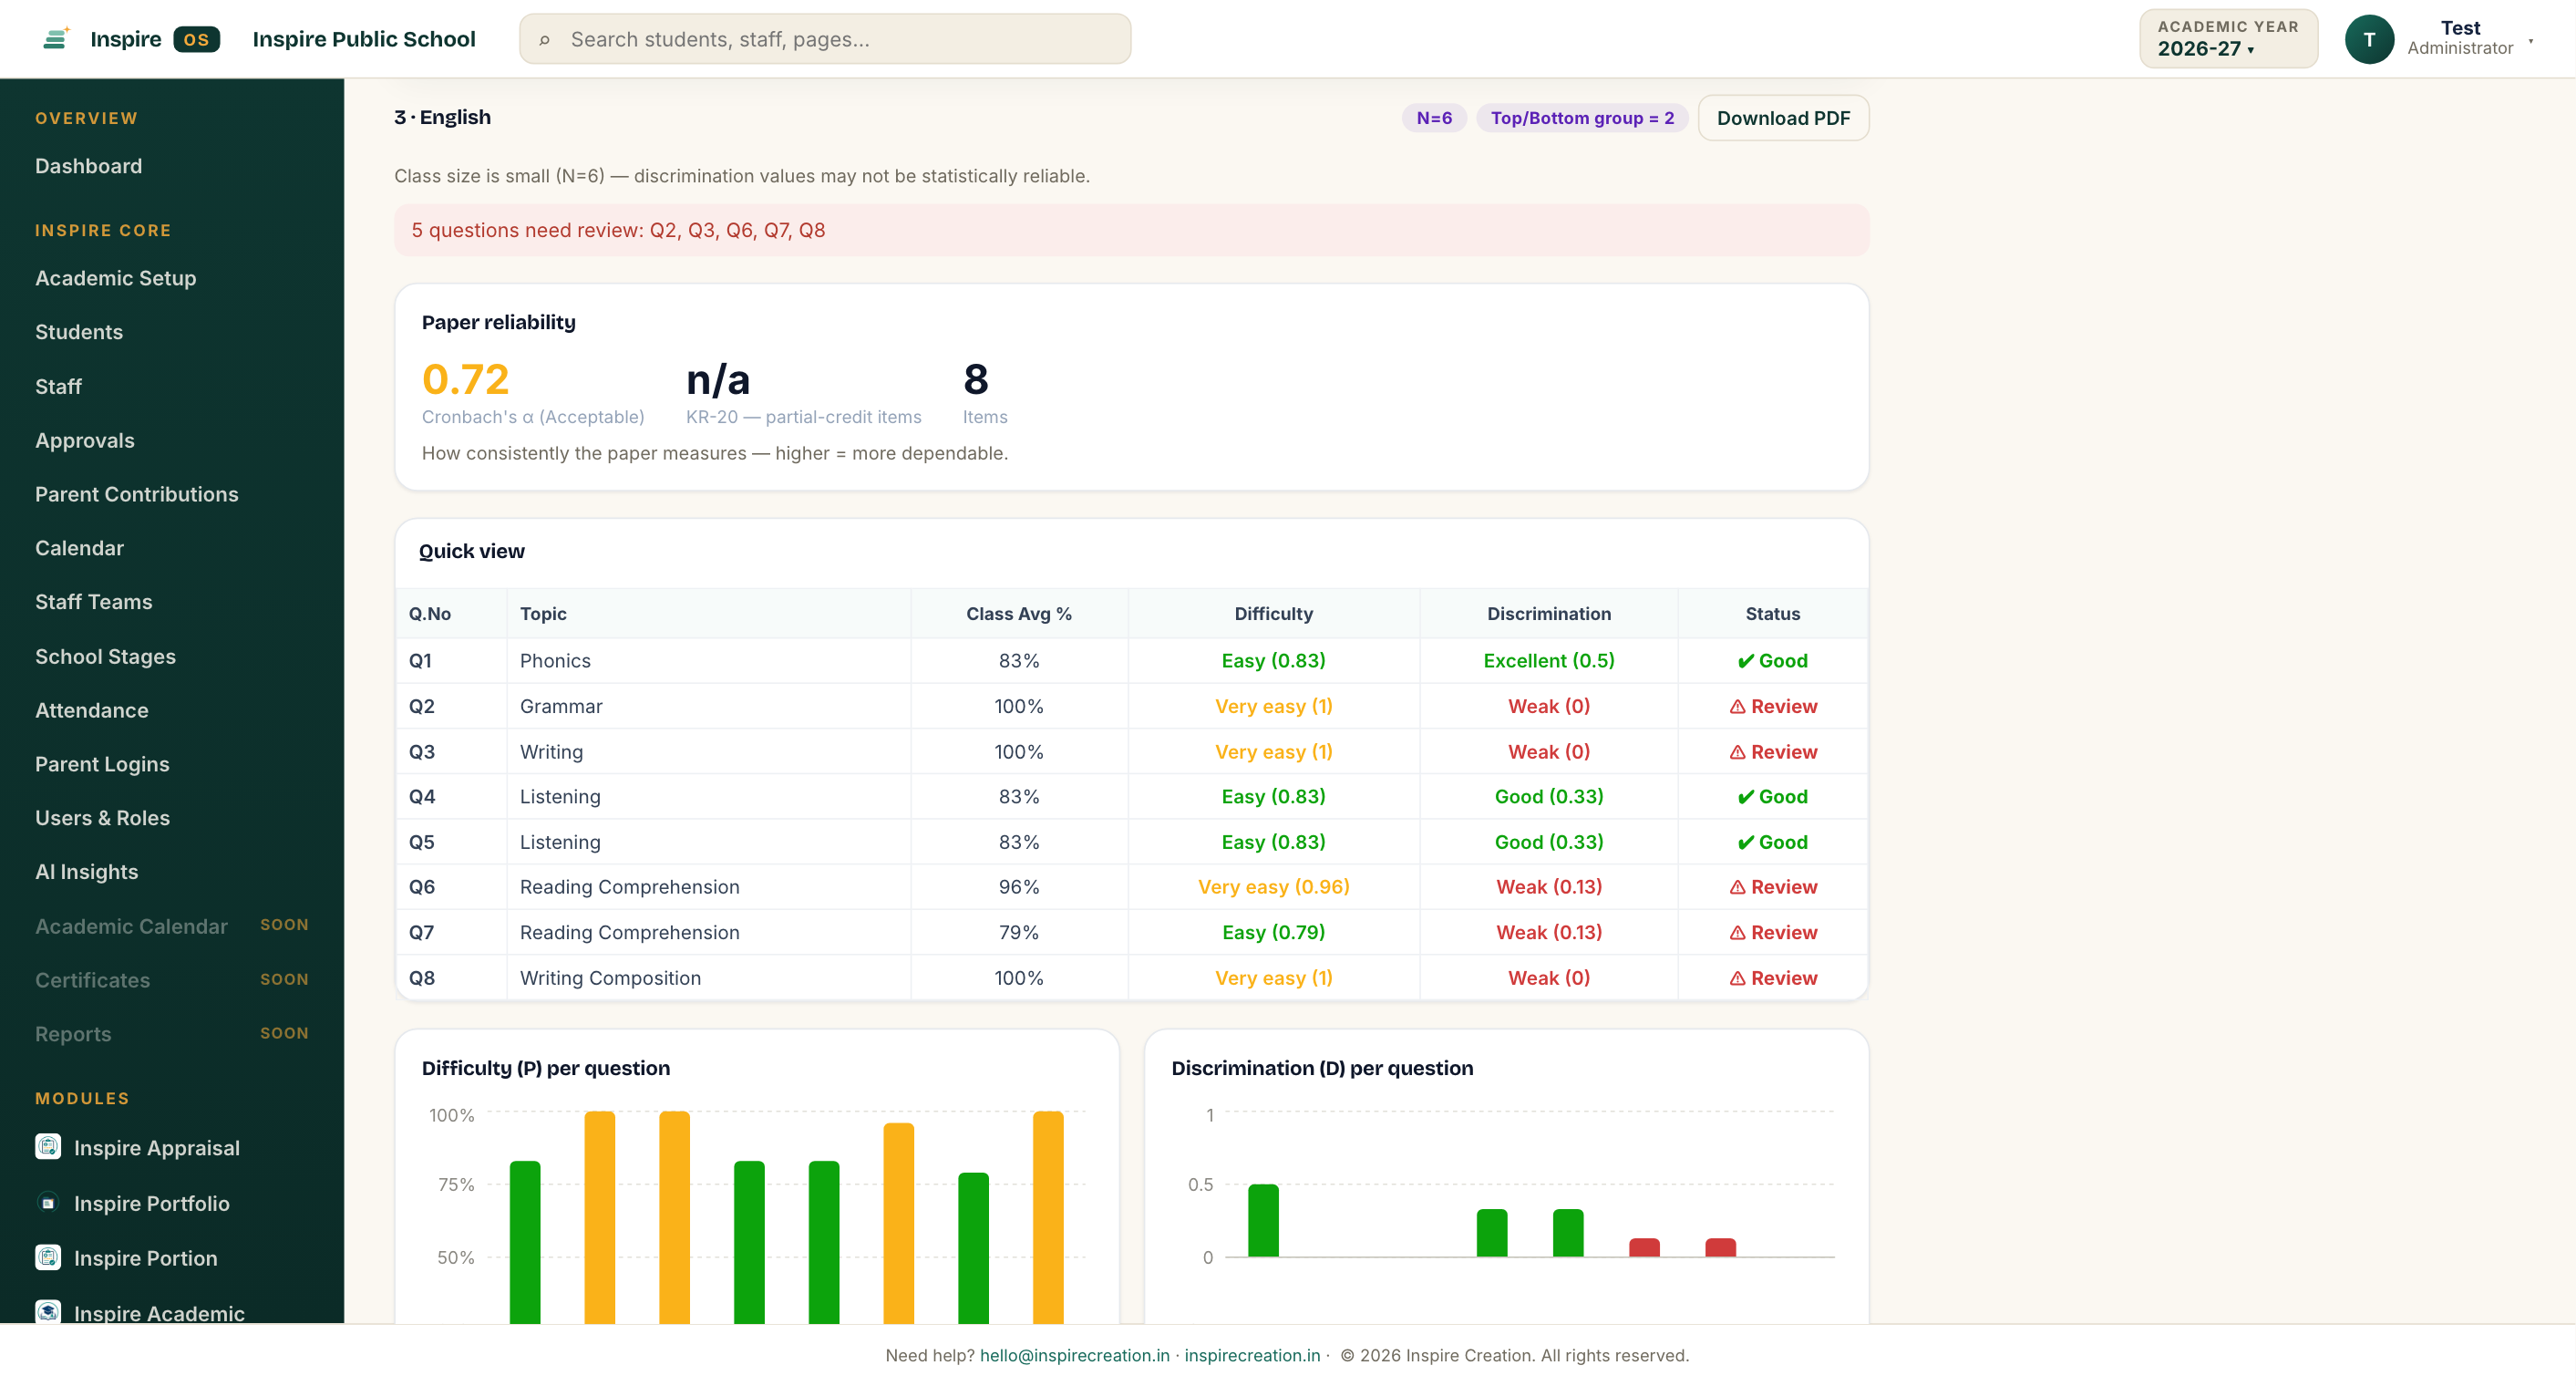
Real item analysis
Difficulty and discrimination for every question, the top-and-bottom-27% method, point-biserial correlation — the psychometrics that tell you which questions actually worked, and which to fix.
Paper reliability
Cronbach’s alpha and KR-20 for the whole paper, with honest, plain-language guidance — so you know whether an exam measured consistently, not just what the scores were.
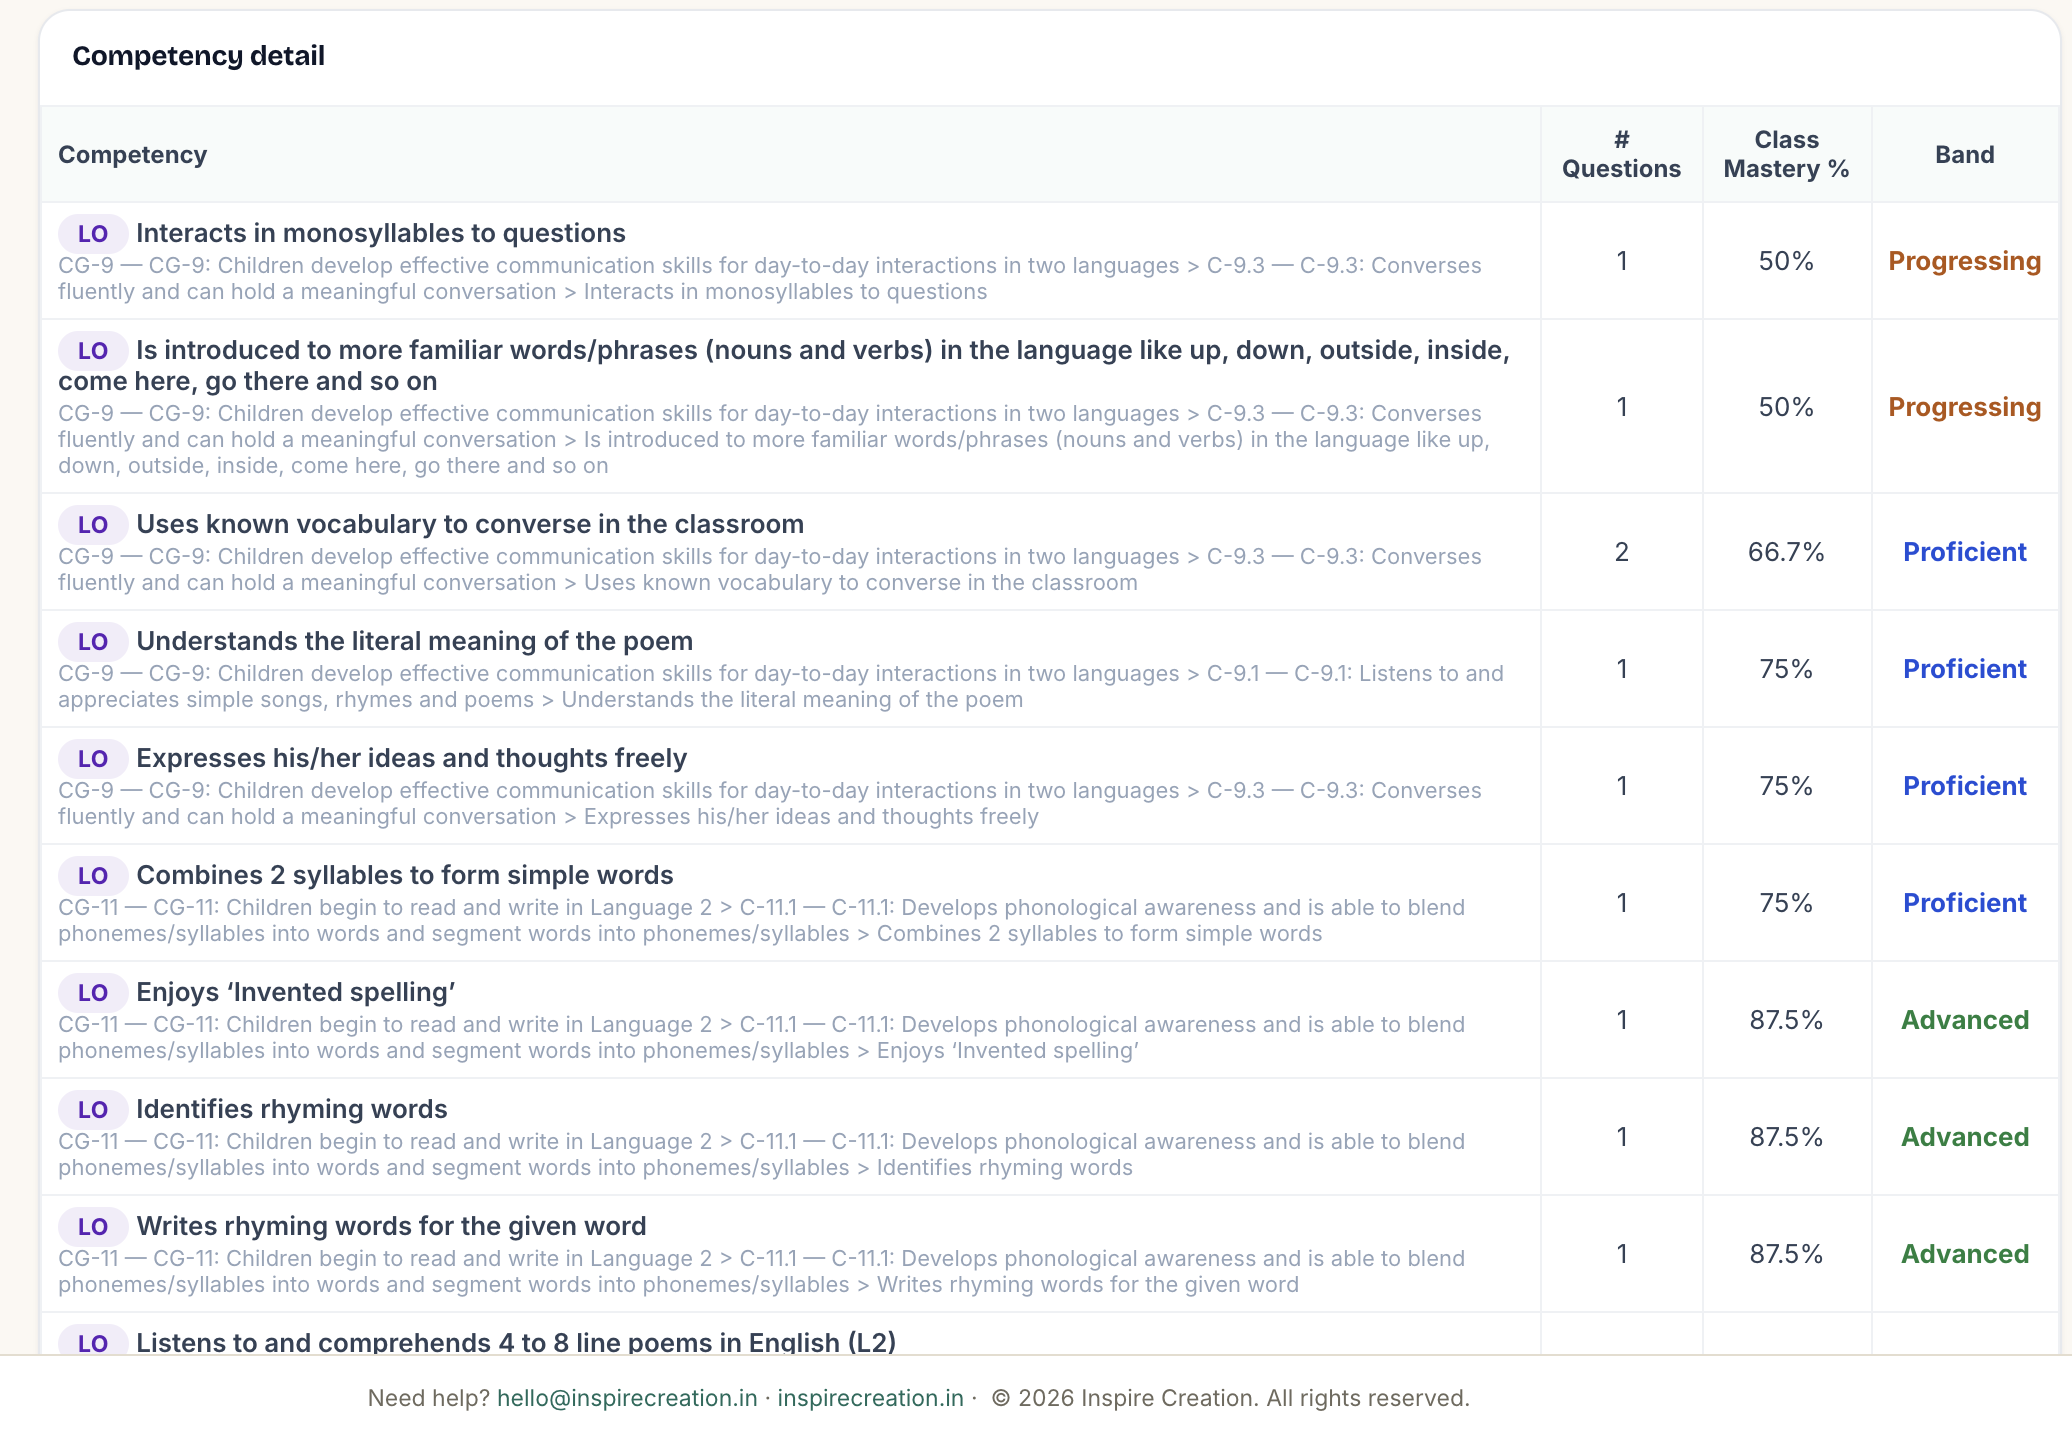
Competency mastery
Tag questions to your curricular goals, competencies and learning outcomes, and see mastery per competency across the class — with a reteach list of exactly what to revisit before moving on.
Question-type & Bloom analysis
See how the class did by question type and by cognitive level — and a clear signal when higher-order thinking is lagging behind recall, the pattern NEP and NCF ask schools to close.
Every child’s progression
Track a student exam to exam, in one subject or across all — the “62 → 71 → 78” story, against the class average, in language a parent understands at the meeting.
Whole-exam and cross-exam views
Analyse a single subject, a whole exam across subjects, or a class’s journey across the term — the same results, seen at every level a school works at.
Ready to print
Student reports, class summaries, progression reports and full item-analysis records — branded to your school, downloadable as PDFs for the file, the parent and the moderation panel.